

Introduction
Node.js is popular for its event-driven, non-blocking I/O model, which makes it a great choice for building scalable web apps. We use techniques like efficient asynchronous programming, caching mechanisms, database query optimization, and profiling tools to optimize its performance. In this blog, we’ll explore how to improve Node.js performance.
Why choose Node.js for web application development?
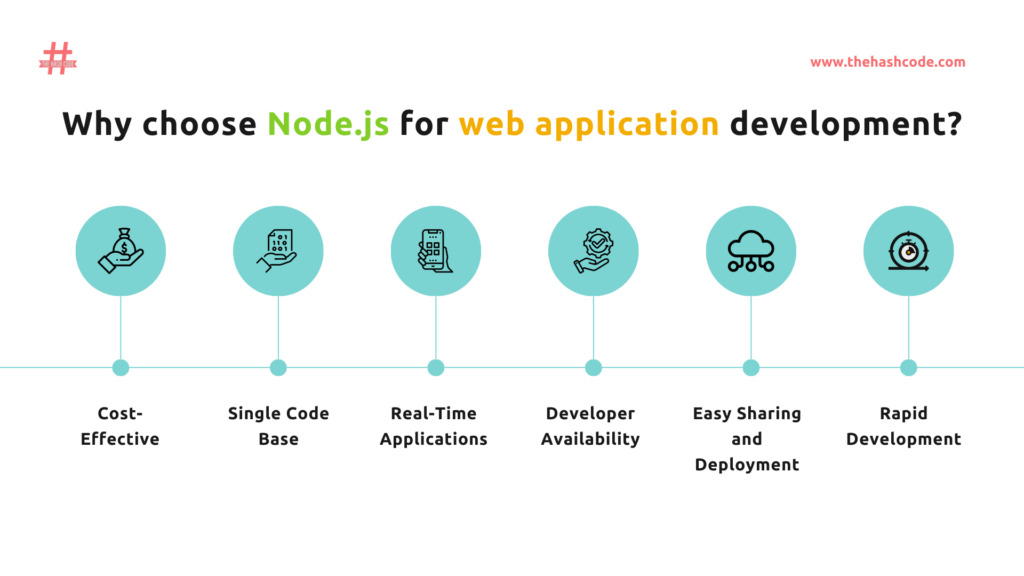
- Cost-Effective: Node.js uses a single programming language (JavaScript) for front-end and back-end development. This reduces the need for separate developers and saves on resources while requiring less code and fewer files, thus reducing development time and costs.
- Single Code Base: Node.js allows using JavaScript for client-side and server-side development, reducing the need for specialized developers and simplifying the process.
- Real-Time Applications: Node.js is ideal for real-time data-driven apps like chat, gaming, or streaming. Its efficient, non-blocking, event-driven architecture easily handles multiple connections.
- Developer Availability: Node.js is popular for full-stack development and finding skilled developers.
- Easy Sharing and Deployment: Node.js streamlines code and package sharing via NPM, speeding up development and deployment.
- Rapid Development: Node.js is ideal for fast prototyping and microservices due to its simple server setup and API creation.
Monitoring and Benchmarking Tools:
Node.js performance monitoring is crucial for maintaining optimal application performance. Several monitoring tools are available to help developers track and improve Node.js performance. Some popular tools include:
New Relic
New Relic is a comprehensive application performance monitoring (APM) tool that offers specialized agents for Node.js, providing detailed insights into application performance. It is excellent at analyzing response times, errors, and critical transactions in Node.js environments. New Relic correlates data to understand how backend actions affect user experience. It supports a wide range of metrics and is known for its strong observability features, making it a preferred choice for engineers.
To use New Relic for Node.js:
- Sign Up and Install: First, sign up for a New Relic account and install the New Relic Node.js agent in your application.
- Configure: Follow the instructions to configure the agent with your New Relic license key.
- Monitor: Once configured, New Relic will automatically start monitoring your Node.js application, providing real-time performance data, error tracking, and transaction tracing.
DataDog
DataDog is another robust APM solution that provides dedicated agents for Node.js, offering detailed metrics and traceability. It provides comprehensive back and front-end monitoring, including metrics, request tracking, and custom visualizations. DataDog’s platform provides a complete view of the technology stack, enabling issue resolution across all application layers. It has robust tools for monitoring browser performance, including Node.js, and provides detailed insights on page load times, JavaScript errors, and resource performance.
Here’s how to use DataDog with JMeter:
- Install Datadog Backend Listener: Download and install the Datadog Backend Listener plugin for JMeter. This plugin can be found in the JMeter Plugin Manager or the DataDog repository.
- Configure the Plugin: Configure the plugin with your DataDog API key after installation.
- Run JMeter Test: Execute your JMeter test as usual. The Datadog Backend Listener will send test metrics to your DataDog account.
- Visualize Results: Access the out-of-the-box JMeter dashboard in DataDog to visualize key metrics such as total requests, failed requests, error rate, latency, and response times. You can also correlate these metrics with other system vitals like CPU and memory usage to understand the impact of increased traffic on your application’s performance.
Apache JMeter
Apache JMeter is an open-source load-testing tool based on Java, primarily used for testing web application performance. It can test performance for dynamic and static resources and dynamic web applications. JMeter allows the simulation of heavy loads on individual servers, groups of servers, networks, or objects to test strength and analyze performance under different load types. It has a user-friendly GUI and is easy to use with less infrastructure needed for testing. JMeter CLI loads performance tests from Linux, Mac OSX, and Windows, making it versatile.
Here’s a basic example of how to use JMeter:
- Install JMeter: Download and install Apache JMeter from the official website.
- Create a Test Plan: Launch JMeter and create a new test plan. Add elements like Thread Groups, HTTP Requests, and Listeners to define your test scenario.
- Configure HTTP Request: In the HTTP Request sampler, specify the server’s name or IP and the path to your Node.js application.
- Run the Test: Configure the Thread Group to specify the number of threads (users), the ramp-up period, and the loop count. Then, run the test.
- Analyze Results: Use the Listener to analyze your test results. JMeter provides various listeners for different types of analysis, such as Aggregate Reports, Summary Reports, and View Results Trees.
Each tool serves a unique purpose in monitoring and benchmarking Node.js performance. New Relic and DataDog are APM tools that offer detailed insights into application performance. Apache JMeter is a load-testing tool for analyzing software performance under various conditions. The choice between these tools depends on your project’s specific needs, such as the level of detail required in performance analysis, the need for load testing, and the preference for open-source versus commercial solutions.
Code-Level Optimization:
Code-level optimization techniques can significantly improve the performance and efficiency of software applications. Here are some key approaches:
Proper Garbage Collection:
Garbage collection automatically reclaims memory occupied by objects that are no longer in use, preventing memory leaks. Proper tuning of the garbage collector is crucial:
- Adjust heap size parameters (-Xms, -Xmx) to avoid excessive memory usage or frequent garbage collections.
- Choose the appropriate garbage collector algorithm (e.g., G1, CMS, ParallelGC) based on application requirements like throughput, latency, and heap size.
- For optimal performance, tune garbage collector settings like parallel thread count, occupancy thresholds, and heap region sizes.
Asynchronous vs. Synchronous Code:
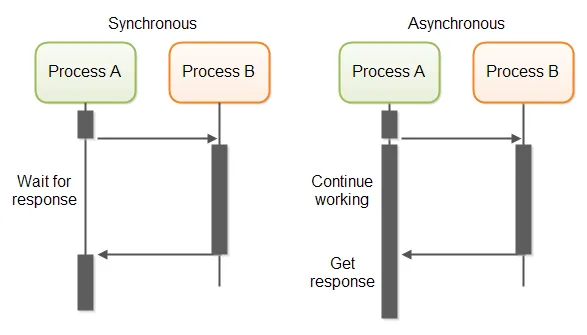
Here is a the key differences between Asynchronous and Synchronous Code:
| Aspect | Asynchronous Code | Synchronous Code |
|---|---|---|
| Execution Order | Tasks can run independently and concurrently, not waiting for each other to finish. | Code runs in a linear sequence, with each operation needing to be finished before the next one starts. |
| Blocking Operations | Allows other operations to continue running while waiting for tasks to be completed. | Each operation must wait for the previous one to complete, potentially leading to inefficiencies and delays. |
| Code Structure | Can lead to more complex code structures, making it harder to understand and maintain. | Code executes in a sequential order, making it straightforward and predictable. |
| Resource Utilization | Makes better use of system resources by not waiting idly for tasks to complete. | Can be resource-intensive, especially if the system waits idly during long operations. |
| Debugging | Due to non-linear execution, it can be more challenging to trace and debug. | Easier to trace and debug due to its linear execution. |
| Performance | Can handle more tasks simultaneously, leading to better performance and responsiveness in applications. | Predictable execution order may limit performance and scalability, especially in distributed computing scenarios. |
| Use Cases | Ideal for scenarios where tasks can be executed independently and in parallel, improving throughput and responsiveness. | Effective for simple, brief tasks that must be executed in a specific sequence, suitable for CPU-bound operations. |
Optimizing Loops and Iterations:
Loops and iterations are common performance bottlenecks that can be optimized:
- Avoid unnecessary object creation within loops by reusing existing objects.
- Use appropriate loop constructs (for, while, for each) based on the iteration pattern.
- Leverage vectorization and parallelization techniques like SIMD instructions or parallel streams for data-parallel operations.
- Implement loop unrolling, loop fusion, and loop invariant code motion optimizations where applicable.
By employing these code-level optimization techniques, developers can significantly enhance the performance, scalability, and efficiency of their software applications.`
CPU and Memory Management:
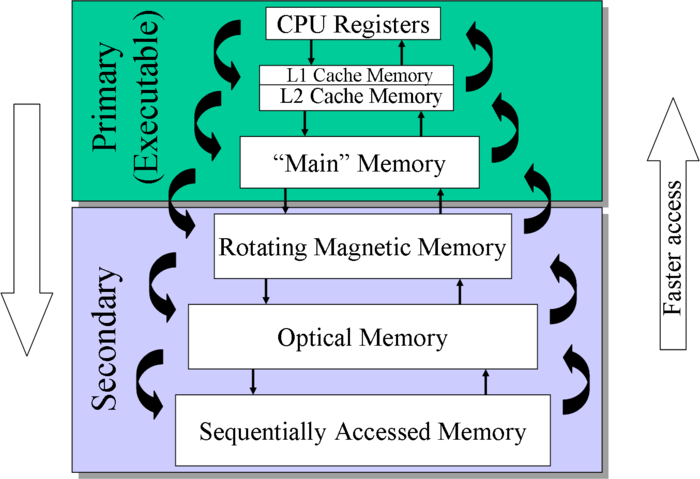
Memory Management:
Memory management is a critical aspect of computer systems, ensuring efficient allocation and deallocation of memory resources. Here are key points related to memory management:
- Virtual Memory: Virtual memory systems separate memory addresses used by processes from physical addresses, enhancing system performance and allowing for larger virtual address spaces.
- Memory Allocation: Memory allocation involves locating unused memory blocks for program use, managed through techniques like fixed-size blocks allocation and slab allocation.
- Memory Protection: Memory protection mechanisms prevent unauthorized access to memory, safeguarding system integrity and data security.
- Memory Management Unit (MMU): The MMU is a hardware component that handles memory and caching operations, translating virtual memory addresses to physical addresses and ensuring efficient memory use.
CPU and Thread Optimization:
Optimizing CPU and thread usage is crucial for enhancing system performance and responsiveness. Here are key considerations for CPU and thread optimization:
- Garbage Collection Optimization: Tuning garbage collection settings is essential for high-throughput, low-latency Java applications, ensuring optimal performance and resource utilization.
- Thread Management: Efficient thread management involves balancing CPU resources among threads, minimizing contention, and maximizing parallelism for improved application performance.
- Task Assignment Optimization: Optimizing task assignment to CPU threads can enhance throughput and reduce latency in high-performance applications.
- Memory and CPU Management: Proper memory and CPU management, including techniques like mlockall and msync, play a vital role in system stability and performance.
By focusing on memory management strategies, CPU optimization techniques, and effective thread management, developers can create high-performance applications with optimized resource utilization and responsiveness.
Caching:
Here’s a comparison of in-memory session storage and external storage for sessions using Redis and MongoDB:
In-Memory Session Storage (Redis):
- Speed: Redis stores data in-memory, providing extremely fast read/write access with sub-millisecond latency, ideal for real-time session management.
- Simplicity: Redis has a simple data model and straightforward APIs, making it easy to store and retrieve session data.
- Scalability: Redis supports data sharding and replication for horizontal scaling and high availability.
- Volatility: Data in Redis is volatile by default, so sessions may be lost on server restarts unless persistence is enabled.
External Storage for Sessions:
Redis:
- Persistence: Redis offers persistence options like snapshotting (RDB) and append-only file (AOF) to store session data durably on disk.
- Hybrid Approach: Redis can be used as a cache for frequently accessed session data, while persisting less frequently used sessions to disk for durability.
MongoDB:
- Durability: MongoDB is a disk-based database, providing durable storage for session data that needs to be retained long-term.
- Rich Query Support: MongoDB’s document data model and query language allow for complex querying and indexing of session data.
- Scalability: MongoDB supports horizontal scaling through sharding and replication for high availability.
- Performance Trade-off: Disk-based storage in MongoDB may have higher latency compared to in-memory Redis for session access.
A common architecture is to use Redis as an in-memory cache for active sessions, while persisting long-lived or less frequently accessed sessions to MongoDB for durability and historical data retention. This hybrid approach combines the speed of Redis with the persistence and rich querying capabilities of MongoDB, providing a robust and scalable solution for session management.
Optimize DB Queries:
Query Optimization:
Query optimization is a crucial process in database management to enhance performance and efficiency. Here are key insights and techniques related to optimizing database queries:
- Indexing Strategy: Indexes play a vital role in query performance by speeding up data retrieval. Choosing the right columns to index, especially those frequently used in WHERE, JOIN, and ORDER BY clauses, significantly improves query efficiency.
- Query Structure and Rewriting: Simplifying query structures, using appropriate join types, and optimizing subqueries can streamline execution plans and reduce query complexity, leading to faster data retrieval.
- Table Partitioning: Dividing large tables into smaller partitions optimizes query performance by allowing the database to access only relevant data subsets, particularly beneficial for tables with millions of records.
- Column Selection: Avoiding SELECT * and specifying only necessary columns minimizes data retrieval, reducing strain on the database and improving query execution speed.
- Updating Statistics: Keeping database statistics up-to-date enables the query optimizer to generate efficient execution plans, preventing suboptimal query performance.
- Optimizing Joins: Choosing appropriate join techniques and conditions to minimize the number of rows involved in joins significantly enhances query performance, emphasizing the importance of understanding data relationships.
- Query Caching: Implementing caching mechanisms to store frequently accessed query results reduces the load on the database server and enhances response time, improving overall system performance.
- Normalization and Denormalization: Properly normalizing databases reduces redundancy and maintains data integrity, while judicious denormalization can sometimes improve performance by minimizing the number of joins required.
- Database Configuration Optimization: Fine-tuning database configuration settings, such as memory allocation and parallelism, based on workload patterns and available hardware resources, can significantly impact query performance.
Connection Pooling:
Connection pooling is a technique used to manage database connections efficiently, reducing the overhead of establishing and tearing down connections for each user request. Here are key points related to connection pooling:
- Efficient Resource Utilization: Connection pooling allows reusing existing database connections, reducing the overhead of creating new connections for each user request, leading to improved performance and scalability.
- Connection Reuse: By maintaining a pool of established connections, connection pooling minimizes the time and resources required to establish new connections, enhancing system responsiveness.
- Connection Management: Connection pooling handles connection creation, maintenance, and reuse, optimizing resource utilization and ensuring efficient database interactions.
- Concurrency Control: Connection pooling manages concurrent access to database connections, preventing resource contention and improving overall system stability and performance.
By implementing effective query optimization techniques and utilizing connection pooling, database systems can achieve enhanced performance, reduced resource consumption, and improved scalability, ensuring optimal database operations and responsiveness.
HTTP/2 and Requests Optimizing:
Here are some key ways to improve Node.js performance when working with HTTP/2 and optimizing requests:
Leveraging HTTP/2 Server Push:
HTTP/2 allows servers to “push” associated resources to the client before they are requested. This can significantly reduce load times.
- Use res.push() in Express/Node.js to initiate a server push for resources like scripts, stylesheets etc. that the browser will need.
- Identify critical resources to push for initial page loads to maximize performance benefits.
- Be judicious in what is pushed to avoid redundant transfers that can negate performance gains.
Optimizing Request Prioritization
HTTP/2 supports request prioritization, allowing high-priority requests to be processed first.
- Use the createPriorityStream() method to create prioritized request streams in Node.js.
- Prioritize requests for critical resources like HTML documents over non-critical ones like images.
- Monitor network waterfalls to identify prioritization issues delaying high-priority requests.
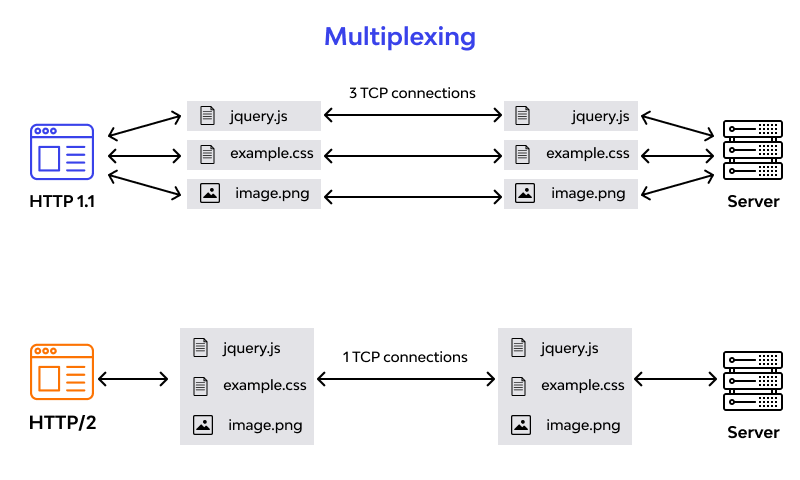
Implementing HTTP/2 Connection Management:
Efficient connection management is key to leveraging HTTP/2 performance benefits.
- Use the http2.connect() method to create a persistent HTTP/2 session with multiplexed streams over a single TCP connection.
- Implement connection pooling and reuse connections via the http2session object to avoid overhead of new connections.
- Monitor and tune settings like maximum concurrent streams to optimize utilization.
Applying General Optimization Techniques:
Combine HTTP/2 features with general optimization best practices:
- Use asynchronous non-blocking operations extensively to maximize throughput.
- Implement caching strategies with Redis/Memcached for frequently accessed data.
- Optimize database queries through indexing, projections, and connection pooling.
- Load test and profile your application to identify and address bottlenecks.
By leveraging HTTP/2 capabilities like server push, request prioritization, and connection management, along with general optimization techniques, Node.js applications can achieve significant performance improvements in response times and resource utilization.
Conclusion:
To improve the performance of your Node.js app, use efficient coding, asynchronous programming, caching, load balancing, and monitoring. Create a scalable Node.js app for dynamic web environments with these strategies. Remember to test your optimizations and measure the impact to ensure consistent and reliable performance gains.
Leave a Comment